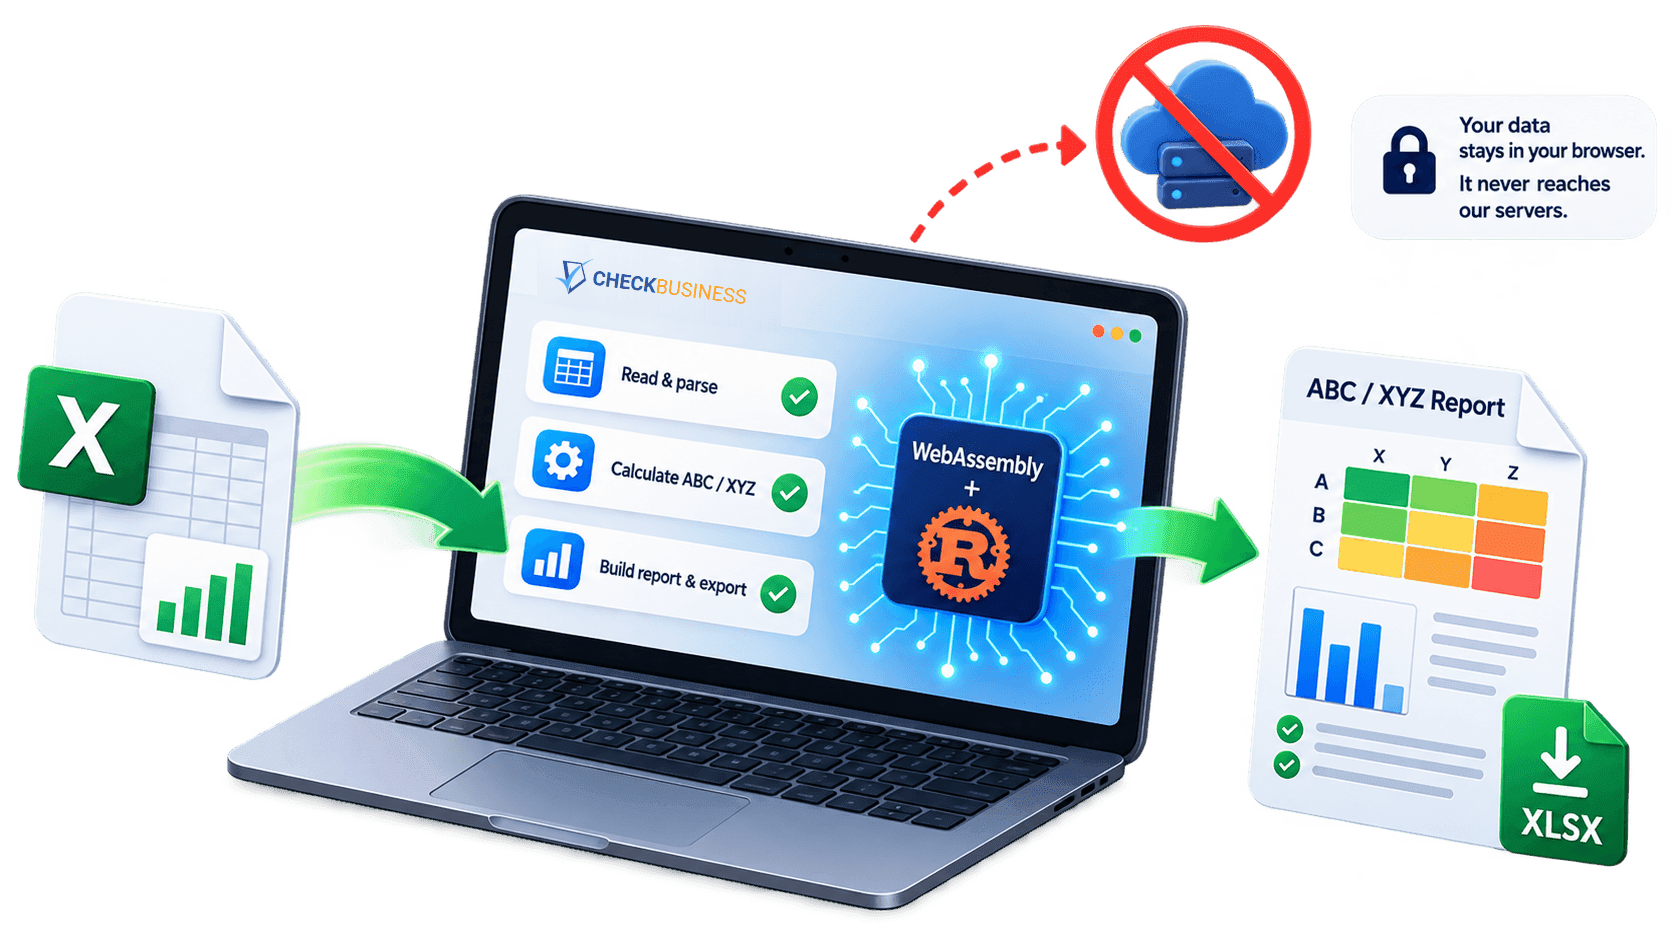
Why nobody wants to hand over a sales export
The file you need for ABC or XYZ analysis is not "just a spreadsheet". It holds your whole range, volumes, prices, sometimes the names of customers or suppliers. From an export like that anyone can see what you earn on, where you are losing, what your margin is and how dependent you are on a single supplier. It is exactly the set of numbers you do not show to outsiders.
For some readers this is no longer a preference but a prohibition: a company policy on AI services and external processors, an NDA with a client, sector regulation. A prohibition is a verifiable fact rather than a taste, and it settles the choice of tool before convenience and price come into it.
So for anyone about to run their range through an online service, the first question is not "how does it work" but "where does my file go". And it is the right question: in a pharmacy, a medical centre or an accounting office, you are the one who will answer for it later.
The usual answer is long: where the servers are, how the connection is encrypted, after how many days everything is deleted, which contract we sign. Here the answer is shorter: the file goes nowhere — it stays in your browser and is calculated there. What follows is why that is possible at all, and how to confirm it yourself without taking anything on trust.
Where your file usually travels
Online tools everyone is used to work in one way: you pick a file, the browser sends it to a server, a program on that server reads it and does the maths, and back comes a finished page with the result. At that moment your export is sitting on someone else's computer. From there on everything depends on someone else's discipline: how long it is kept, which employees can reach it, what ends up in backups, what stays in the logs.
A desktop program works the other way round: it is installed on your machine, it calculates on your machine, and the file does not move. That is precisely why it is easier to get approved — there is nothing there to leak. The price is well known: installation on every workstation, updates, licences, "but I'm on a Mac", "but the bookkeeper has an old laptop".
There is a third option, and it is not new: the program travels to the data, not the data to the program. The browser downloads the calculation module — the same way it downloads the page's images and fonts — and then does the maths on your machine. From the outside it looks like an ordinary website. On the inside it is closer to a desktop program you never have to install. And that arrangement now has a name of its own.
What it is called: structural privacy
The approach described above has a name. It is called structural privacy — privacy that follows from the way a program is built rather than from a promise about it. The difference is simple. A privacy policy tells you what will not be done with your data. Structural privacy tells you what cannot be done with it, because the data never arrives.
Hence its central property: it can be checked. A promise cannot be verified — confirming that a file really was deleted after thirty days would take access to someone else's servers, logs and backups, and you will never have that. The way a thing is built can be verified, from the outside and with your own hands: that is exactly what the next two sections are for, and each check takes five minutes.
The second consequence flatters us less, but it has to be said: this is not our invention. Computing on the browser side has stopped being rare — it is how in-browser analytical engines, image editors and mapping services work, and whole catalogues of tools that run "without uploading" have appeared. So the right question to put to any such service is not "does my file leave", but "how do I check that". If the answer is a clause in a policy, it is a policy, not a structure.
Both checks below are written that way: they know nothing about us and apply to any tool that claims to compute at your end. Ours is simply one of them.
How ours is built
For many years now, browsers have been able to run not only page scripts but real compiled programs. The technology is called WebAssembly; it is what photo editors and mapping services in the browser are built on, where sending every action to a server would be absurd.
Our calculation engine is written in Rust and compiled into such a module. When you open an analysis page, the browser downloads it once, together with the page itself. After that only your device is working:
- you pick the XLSX file, and your browser reads it;
- parsing the table, checking the columns, every calculation, the class matrix and the recommendations all happen on your computer;
- the report is drawn there too, and the XLSX export is assembled in the browser as well.
That is precisely what structural privacy looks like in practice: privacy here is a property of the way the program is assembled, not a clause in the document that describes it.
There is a side effect that is easy to notice: the speed depends on your machine, not on how busy we are. Tens of thousands of rows are processed in seconds — and there is simply nowhere to process them except at your end.
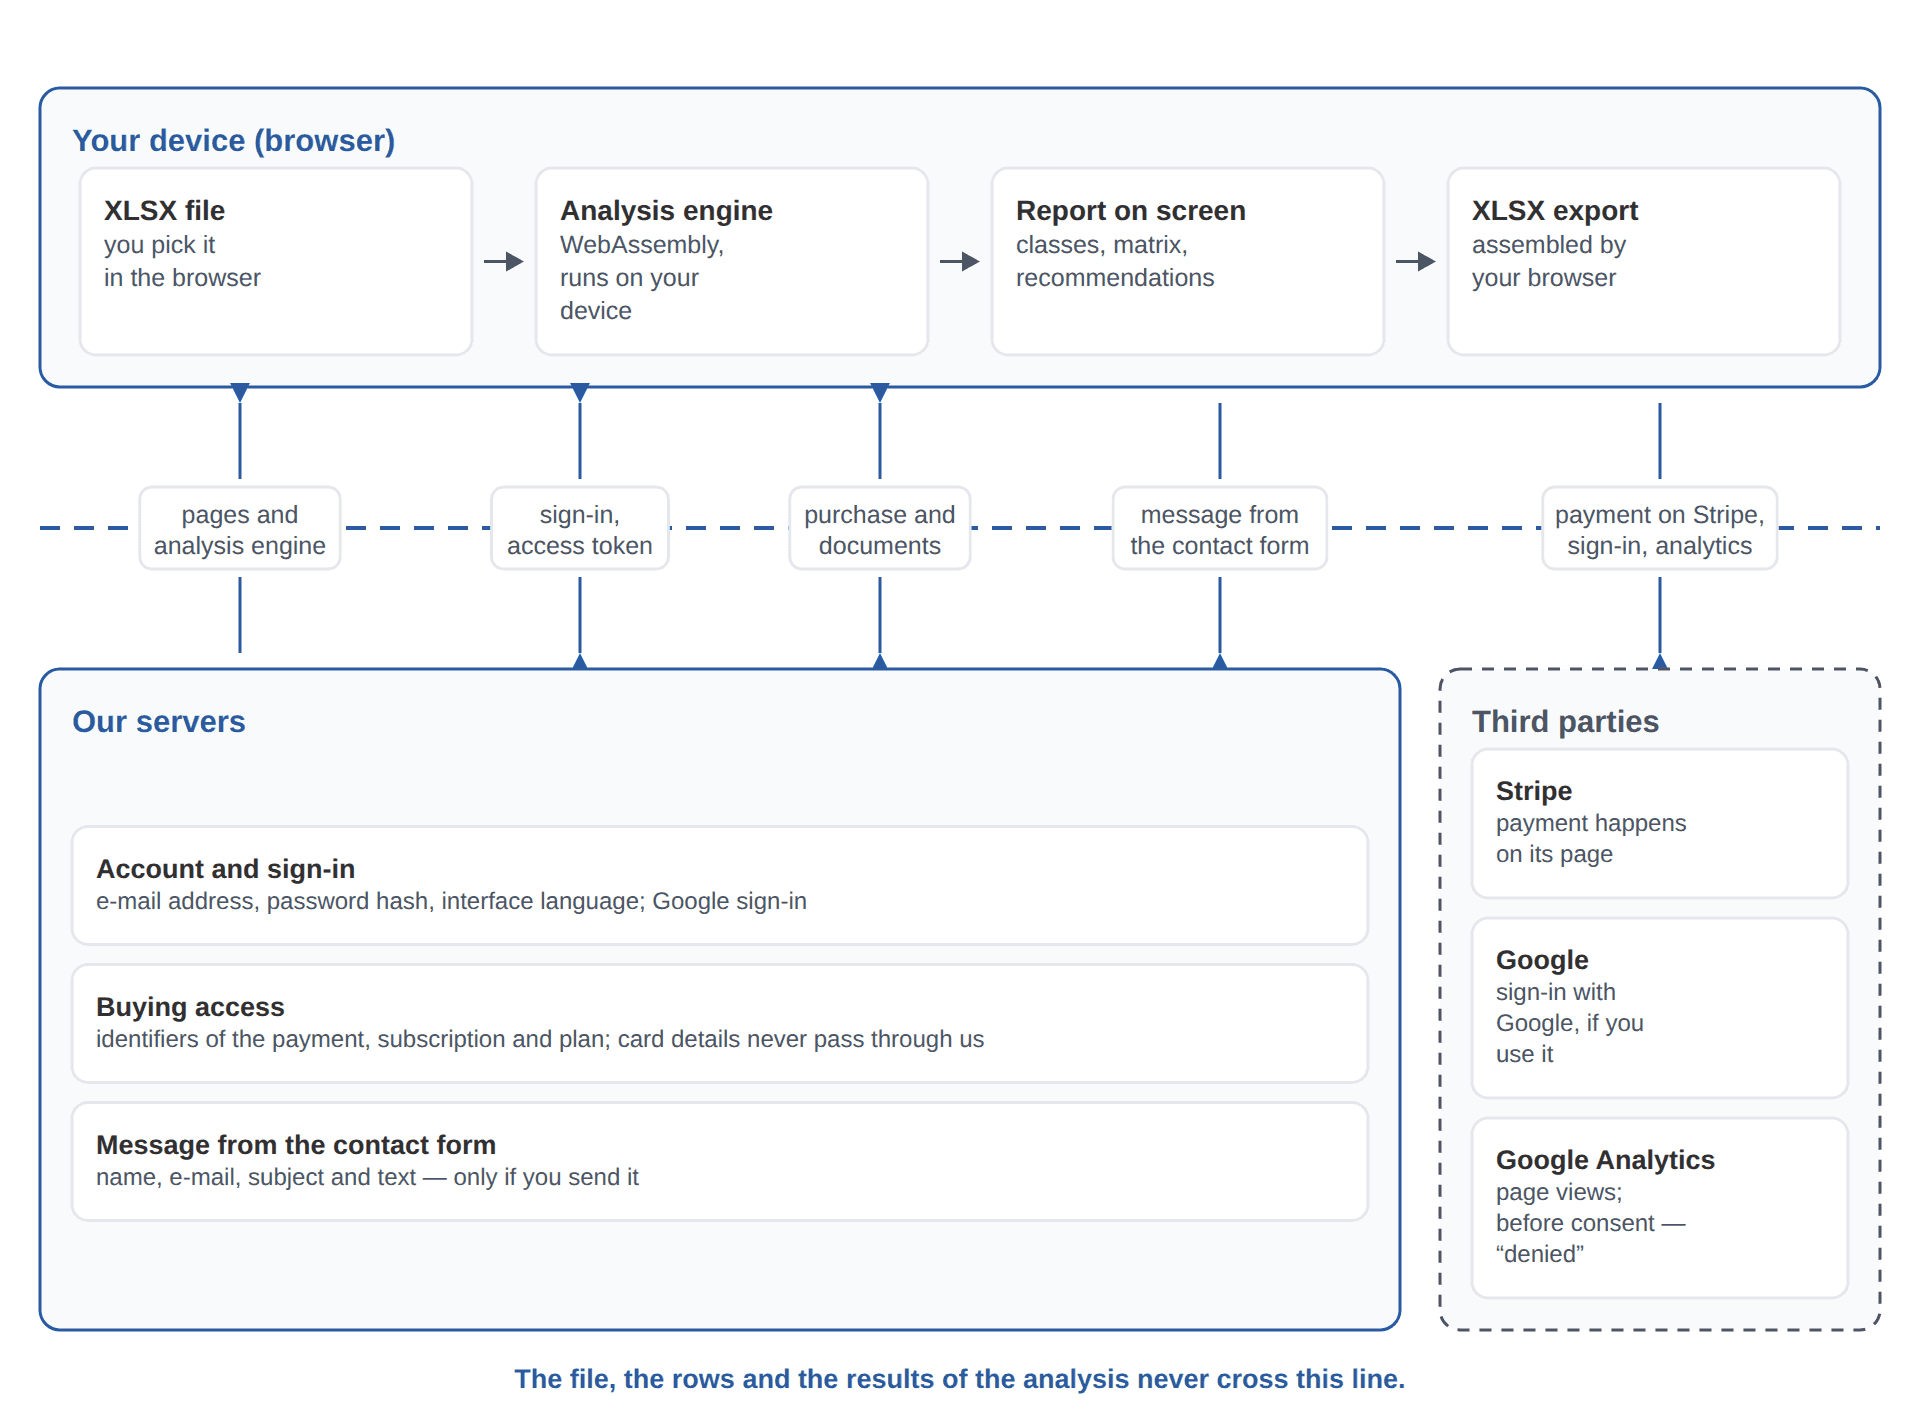
Which brings us to the main point. What never reaches our servers is the file, any row of it, the column names or the results — classes, coefficients, summary figures, the matrix — nor the recommendations, nor the exported report. The only things that cross the boundary of your device are the things without which a website cannot work at all: signing in, payment, and a message from the contact form if you send one. That is what the diagram shows; the full list, down to every address the application calls, is on a separate page, How the data flow works.
And there is a consequence that takes some getting used to as an advantage: we do not know what you analysed, and we do not even know whether you ran an analysis at all. There is no "number of calculations" metric on our side and there cannot be one — it could not be collected without receiving your data.
Check one: switch the internet off
This is the simplest way to be sure, and it needs neither special knowledge nor any trust in what we say. A program that needs a server does not work without a network — so if the analysis runs without a network, it does not need a server. The check knows nothing about us: this is how you test any tool that claims to compute at your end.
- Sign in to your account as usual.
- Open the page of the analysis you need and let it load completely. This matters: the calculation module arrives together with the page, so the network has to go off after the page has opened, not before.
- Switch the internet off — unplug the cable, turn off Wi-Fi or enable flight mode.
- Pick your XLSX file, mark the columns, press "Generate Report".
- Press "Save to xlsx".
The report will be built. The export file will download. If sending the data were required for the calculation, neither of those would happen.
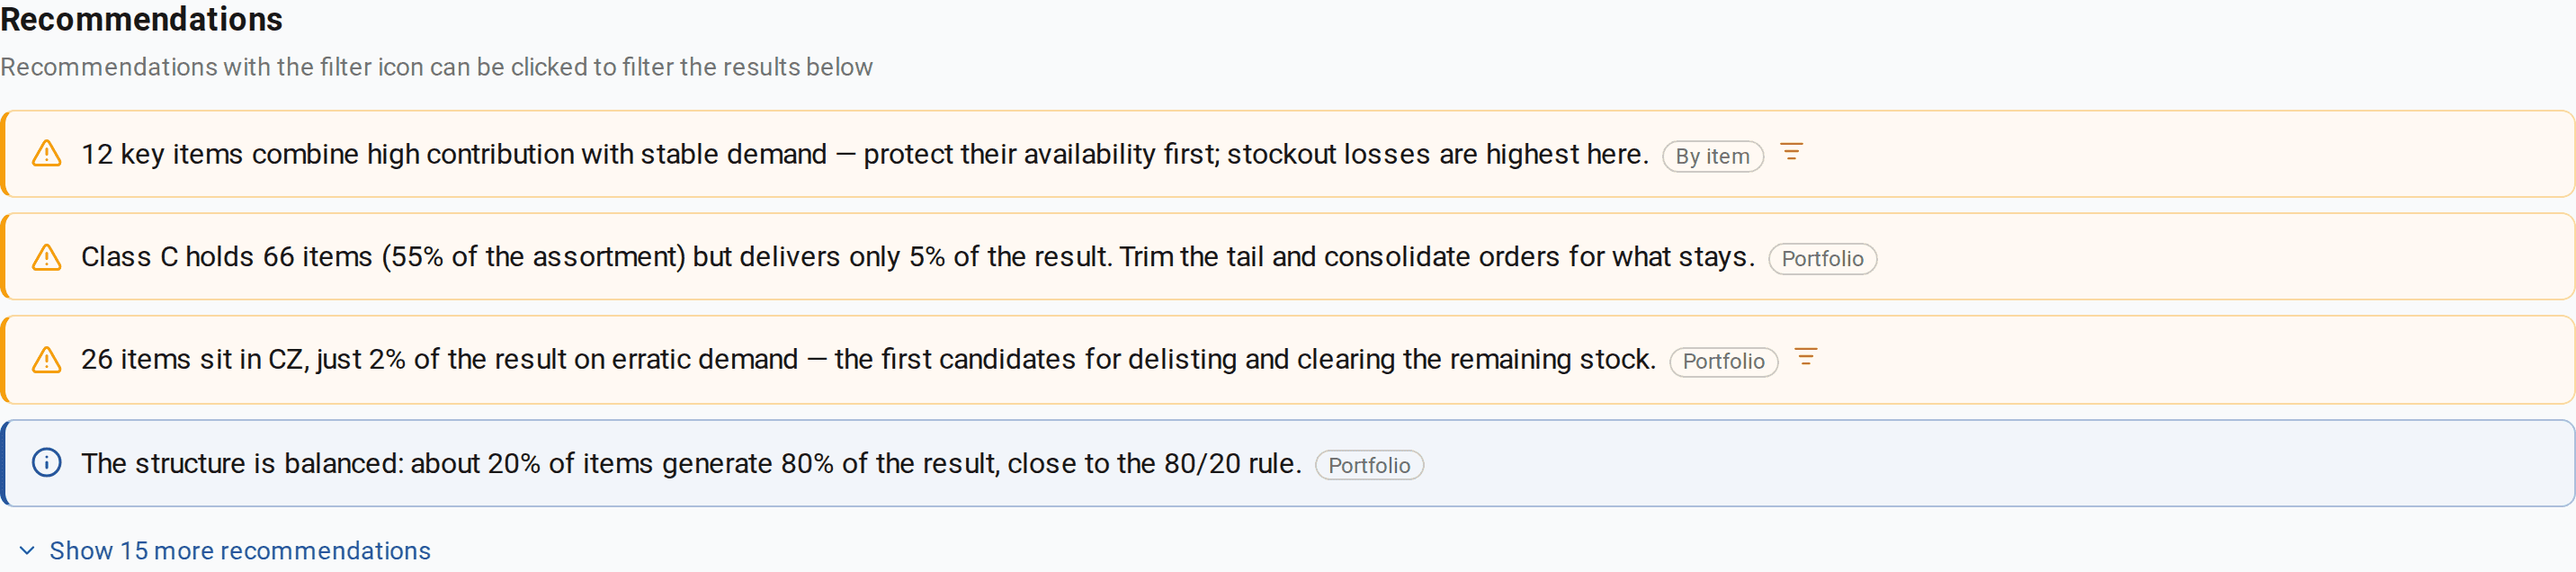
That is exactly how both pictures below were made: a demonstration export of 120 items with monthly sales over a year, XYZ+ABC analysis, the internet switched off as soon as the page had opened.
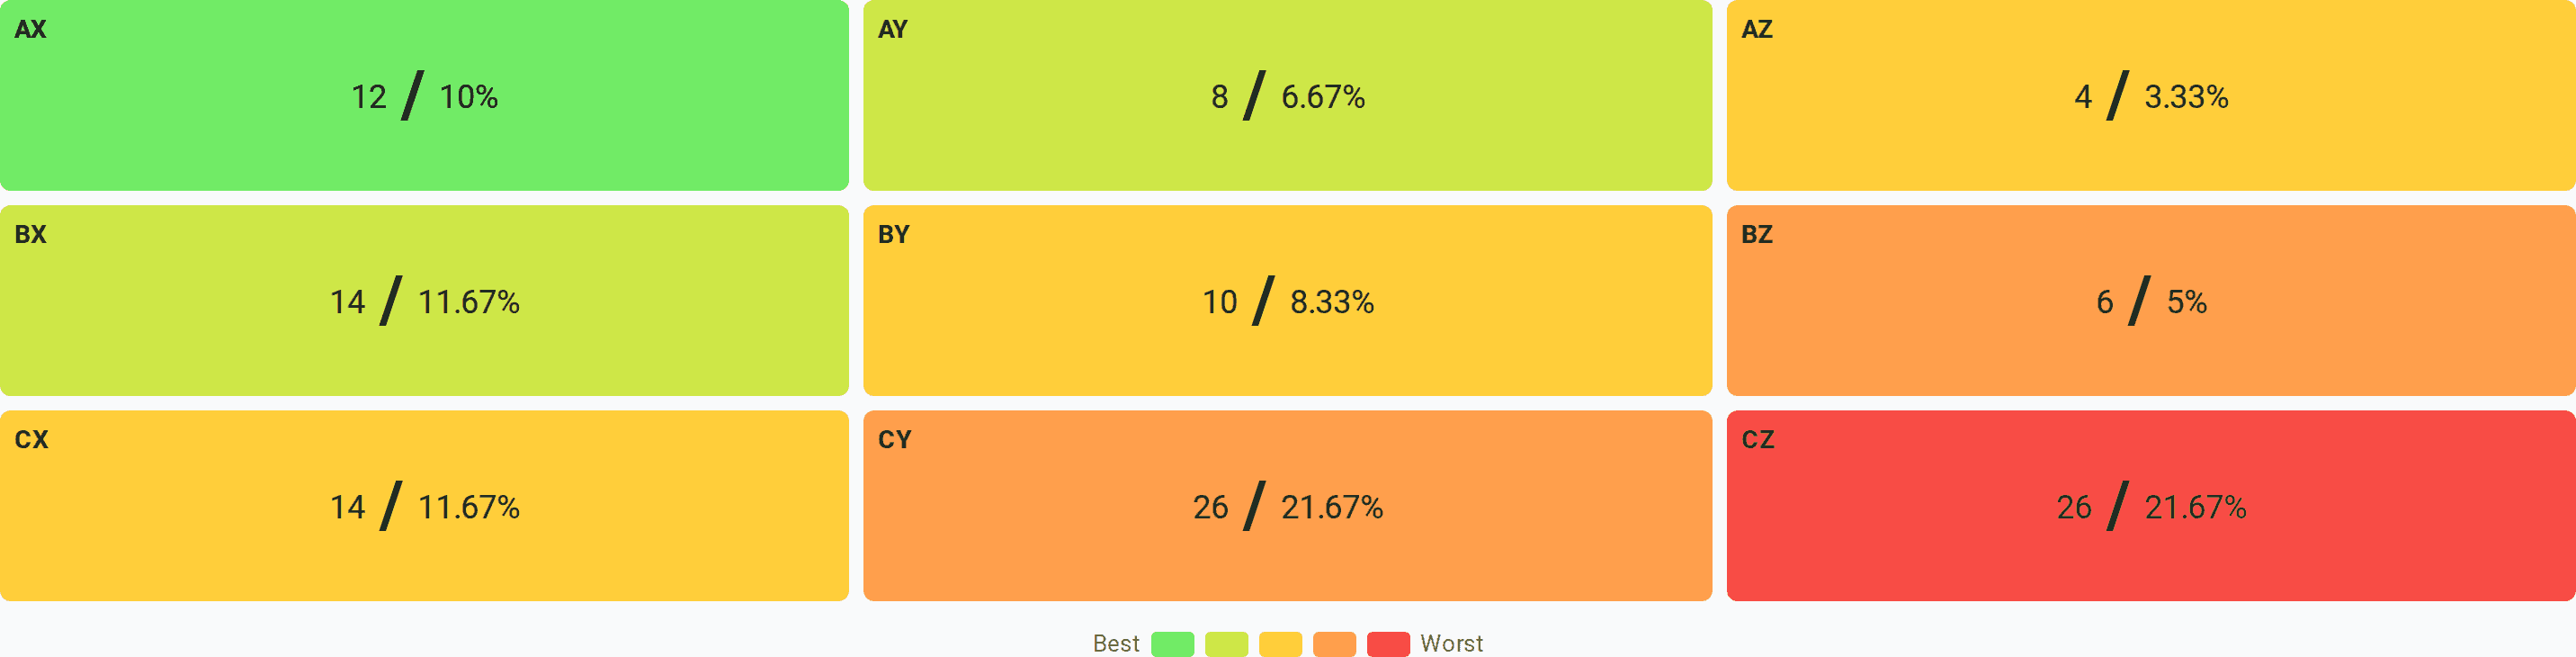
The matrix is the result of two cuts at once. The ABC letter is about contribution: how much the item delivered over the whole period. The XYZ letter is about stability: how evenly it sold from month to month. An AX item delivers a lot and sells steadily, a CZ item delivers little and in bursts, and the decisions for them are opposite. How classes A, B and C are calculated is worked through in What ABC analysis is — in plain language.
The recommendations panel was assembled without a network too — it is built from your own data, and just like everything else it goes nowhere.
One thing is worth knowing in advance so it does not surprise you. While the network is off, the site is offline as a whole: you cannot move to another page or reload the current one — pages arrive over the network. The calculation carries on regardless. When you are done, switch the internet back on; the report on your screen will not change because of it.
Check two: the Network tab
If you would rather not disconnect anything, there is a stricter way — watch what the browser sends while the analysis is running. The tool for that is built into every browser, and you do not have to be a programmer to use it — and the list of requests is equally eloquent on any website.
- On the analysis page press F12 (in Safari, enable the developer menu in the settings first).
- Open the Network tab and clear the list.
- Run the analysis as usual.
- Look at the rows that appear between picking the file and the report showing up.
What you will see: calls from the visit counter (Google Analytics — it is on every page of the site, this one included, and counts page views) — and nothing that has anything to do with your file. Neither to our domain nor to any other. A useful detail: requests that send something have a non-zero size of sent data, so you can sort the list by that column and confirm there was nothing to send.
And this is not a matter of settings. There is no address in the application that accepts a file or analysis results — no such handler exists in the code, so there is no checkbox that could turn one on.
The other side of it
Honestly about what follows from the same architecture, and what it costs.
We cannot restore your analysis. Closing the tab takes it with you: there was no copy anywhere except your browser. So export the report to XLSX if you are going to need it again.
We cannot see what went wrong for you. If a file will not parse or a result looks odd, support does not have your export to look at — you will have to describe it in words or put together an example with anonymised data.
Your computer does the work. On very large files the speed depends on your machine rather than on our server. The flip side is that on an ordinary laptop tens of thousands of rows go through in seconds, and there is no queue for a server.
The analysis page is still a web page. It arrives over the network, it carries the visit counter, and we update it the way any site is updated. That is why we keep a separate page describing the data flow and update it in the same release that changes anything described there: every new call to a server, every new third-party script. An out-of-date description there is not a marketing inaccuracy — it is a false statement made to whoever is checking us.
What to try
Structural privacy differs from a promise in exactly this: the most convincing check is the one you ran yourself. It takes five minutes and needs nothing but your ordinary file: open the analysis page, wait for it to load, turn off Wi-Fi and do the maths.
If you then want to dig into the methods themselves, there are separate write-ups: what ABC analysis is and complex ABC on two measures at once.
Run it and check for yourself
Upload a monthly sales export and get your range split by contribution and by demand stability. Then do the same thing again with the internet switched off — the result will be identical.
Open XYZ+ABC analysis