
Introduction
I run a medical centre that specialises in psychotherapy and addiction treatment and has been on the market for more than 30 years.
A great deal has changed over that time: treatment approaches, patient behaviour, the structure of demand, the competition, the economics of the medical business. But one task never changes for a director — to deliver steady growth without lowering the quality of care and without turning the clinic into a commercial conveyor belt.
Our profile is patients with addictions and mental health disorders: alcohol and other addictions, anxiety disorders, depressive states, panic attacks, adjustment disorders, sleep problems, emotional burnout and the psychosomatic conditions that come with them.
The patient base is extremely heterogeneous. There are patients who go through long-term therapy and come back regularly. There are those who come seasonally. There are those who came once or twice and never returned. There are patients with a high average bill but rare visits. And there are those who come often but generate a small margin.
For the head of a clinic one conclusion follows from that: you cannot manage the whole patient base the same way. That is exactly why I turned to ABC analysis — not as financial reporting, but as a tool for management decisions.
I am not retelling the theory here — it is covered in separate articles: what ABC analysis is in plain language and how the complex ABC method works. What follows is only what I did, what decisions I took and what came of them.
Separately — about confidentiality
For a medical organisation this is not a secondary question. Patient data is confidential information, and I cannot allow it to be handed to third-party platforms.
So I chose a tool where the calculation runs right in the browser: the file is not uploaded to any server, the computation happens on my own computer, and not a single row leaves it. In practice it looks like this: I simply open the table in a web interface and get a report without sending it anywhere.
On top of that I anonymised the export: internal codes instead of names. For the analysis that is enough, because the groups are built from numbers, not from names. It is a useful habit in itself: an anonymised table is one you are not afraid to open in a meeting or show to a consultant.
Step 1. Segmenting by type of care
I did not run ABC on the whole base straight away.
The first step was segmenting patients by the type of care provided. The reason is simple: a long addiction treatment programme and a short course of therapy for an anxiety disorder have fundamentally different models of service consumption. In one table they get in each other's way — a patient who is "expensive" by the standards of one line of care looks cheap by the standards of another, and the groups come out meaningless.
Only after that did I move on to economic segmentation.
Step 2. Complex ABC by margin
I did not build ABC on turnover. A composite annual measure turned out to be far more telling, one that takes into account:
- the margin of a single appointment;
- the number of visits;
- the patient's total margin for the year;
- the patient's economic value to the centre.
That is, I was answering not the question "how much did the patient pay" but the question "what real margin did this patient generate over the year".
For that I took complex ABC — it calculates classes on two metrics at once and brings them together in a single matrix. In my case those were:
- the patient's margin for the year;
- the number of visits per year.
Every patient gets a two-letter code: the first letter is the class by margin, the second is the class by number of visits. AA is a high margin and many visits, AC is a high margin with rare visits, CA is a low margin with frequent visits, CC is a low margin and rare visits.
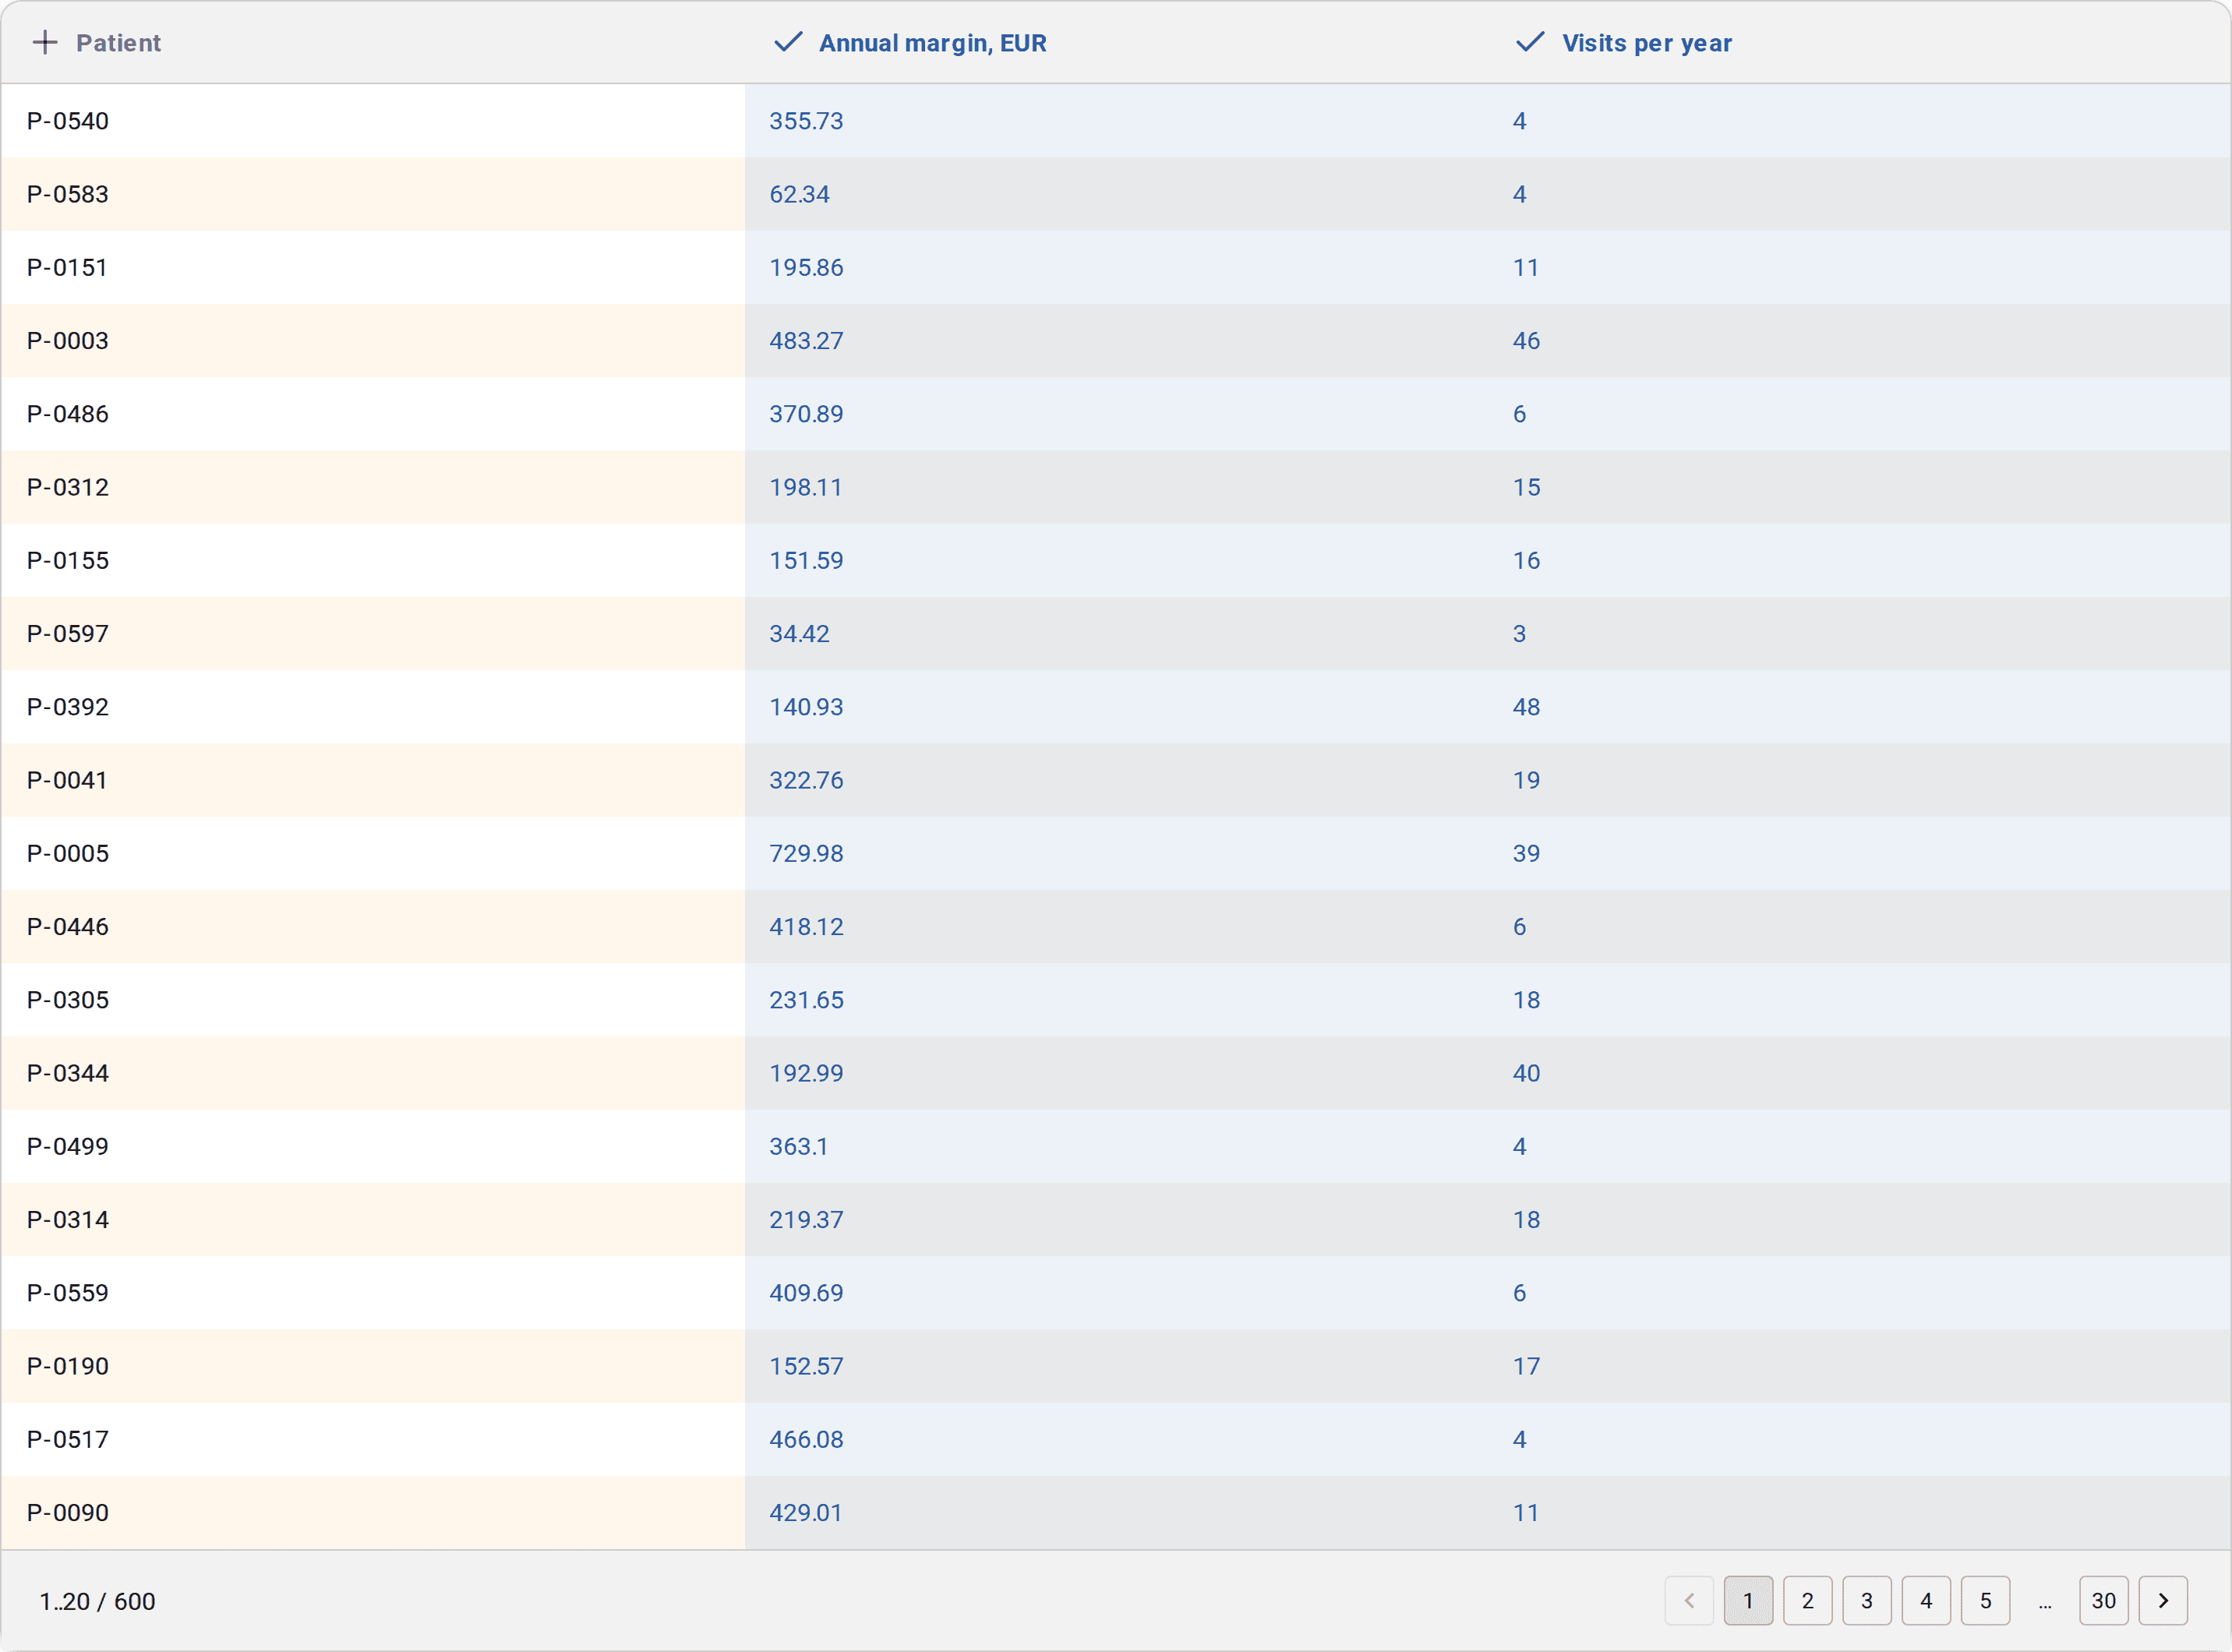
In practice the work takes a few minutes: open the export and tick the two columns you need.
What the matrix showed
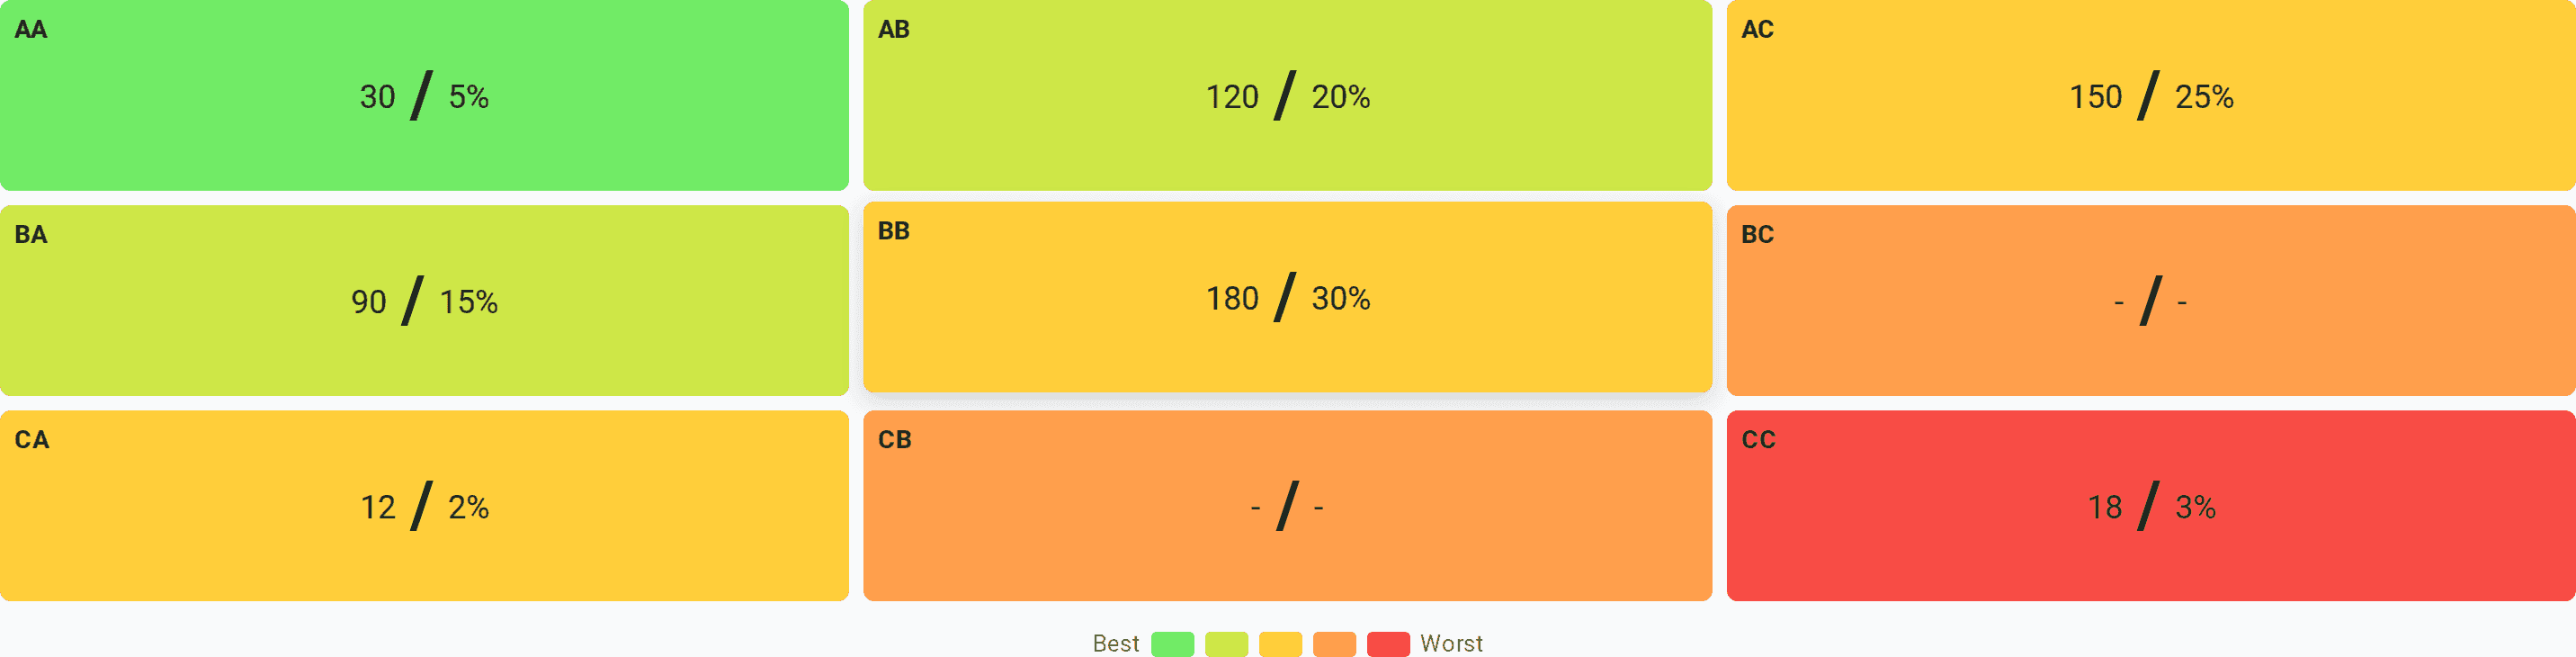
The report is a matrix of nine cells: every combination of the two letters, each showing the number of patients and their share of the base. A cell can be clicked to get the list of exactly those people — and that is what turns the analysis into a working tool rather than a picture.
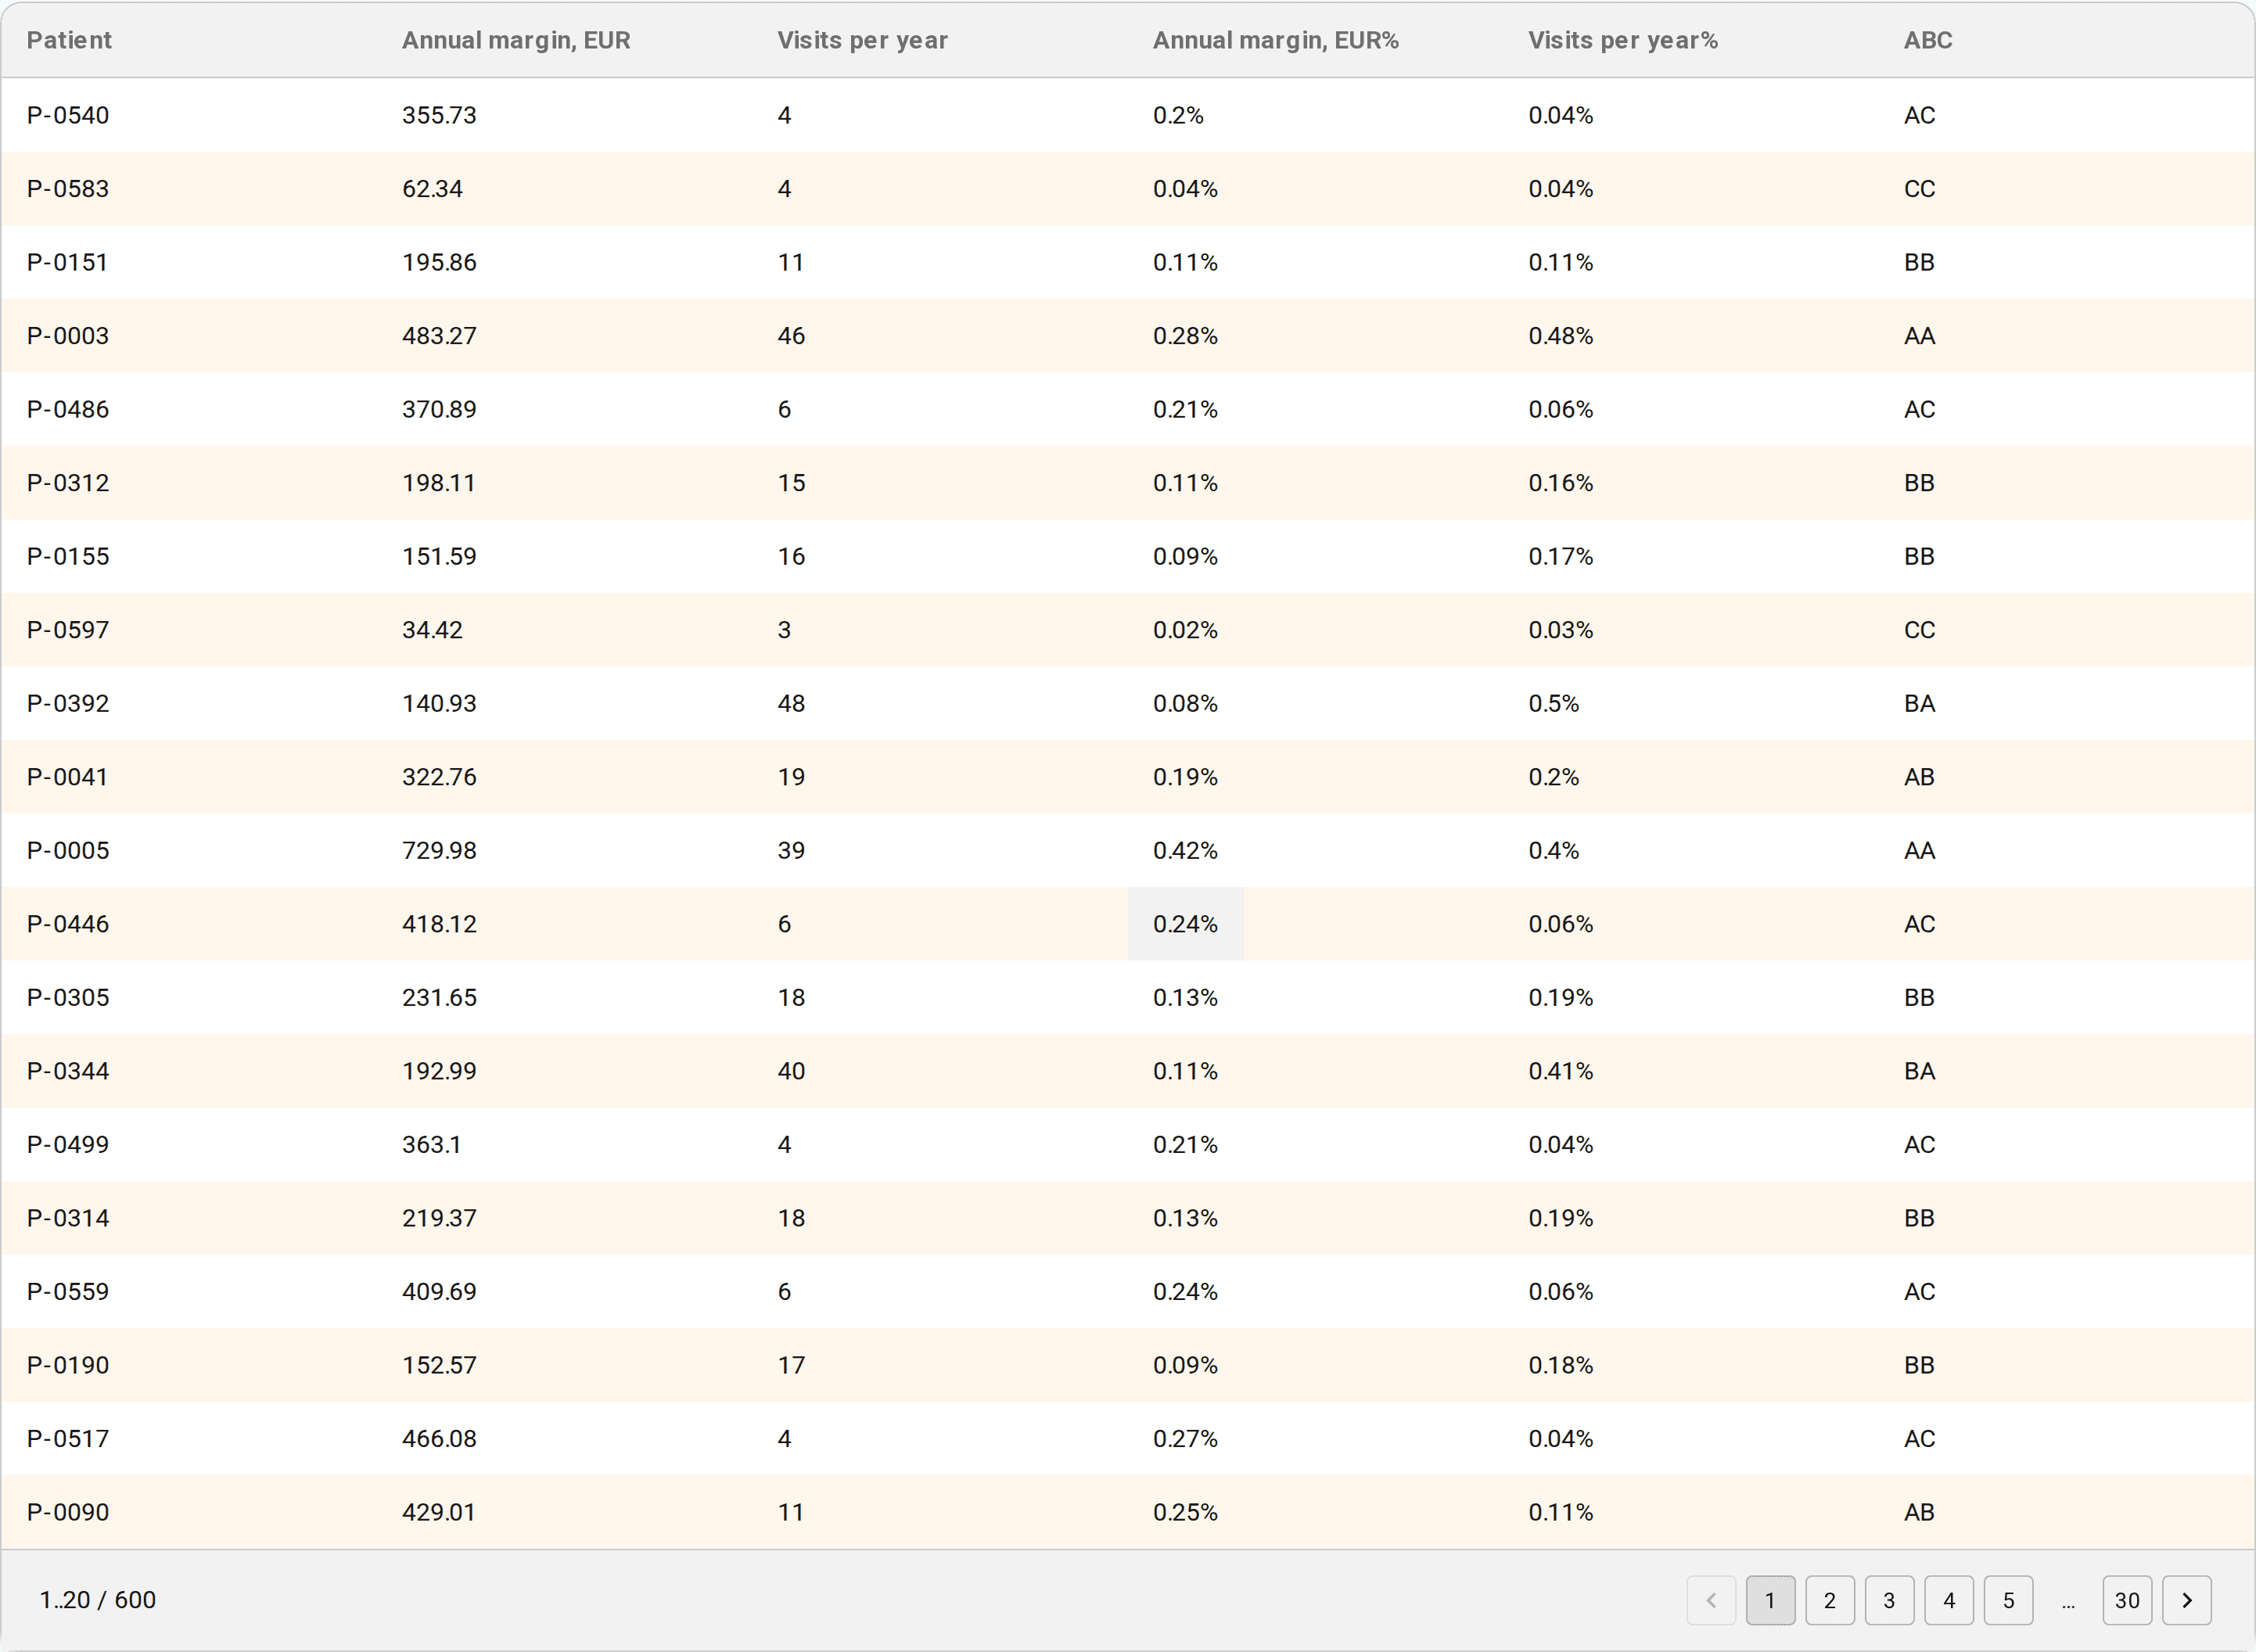
Below the matrix is the same export with the calculation and the code assigned to every row. The report is exported to XLSX, so from there you can work on it with the usual tools.
For my base the distribution came out like this:
- AA — 5% of patients. The highest margin and the greatest financial value to the centre.
- AB, BB, BA — 65% of patients (20%, 30% and 15%). Systematic, regular patients: they come back regularly and go through long-term therapy.
- AC — 25% of patients. A high bill at a low visit frequency, and therefore low economic efficiency.
- CA — 2% of patients. A low margin at a high visit frequency.
- CC — 3% of patients. A low margin and rare visits.
And this is where it gets interesting.
The AB, BB and BA categories are 65% of the base. People who already trust the centre, come back regularly and continue their therapy.
To my mind this is one of the most important conclusions of the analysis: you do not always need to look for new patients. Sometimes the greater growth potential is inside the base you already have.
So the task was not to sell those people additional services aggressively. The task was a different one — to make the structure of comprehensive care more convenient and more coherent.
What we did with each group
After the analysis we did not run one universal campaign for everybody. A separate decision was taken for each group — and that is probably the main practical idea of the whole case.
AB / BB / BA — we strengthened the comprehensive format
For regular, systematic patients we added package offers. The logic is simple: if a person already uses several kinds of care regularly, it is more convenient for them to receive it in a clear comprehensive format.
That increased the volume of services inside the existing base — without constantly buying new traffic.
Result: 30% sales growth in this segment. We did not simply increase the number of patients — we increased the economic return on the base we already had.
AC — a high bill, but low efficiency
The most curious group, 25% of the base. At first glance such patients look attractive: a high bill. But the combination of letters shows what a revenue report does not: the money is there, the frequency is not. If a patient comes rarely, the cost structure of serving them makes their economic value noticeably lower than a single payment suggests.
So we changed neither the product nor the price sharply. We launched a separate campaign with a single goal — to raise the frequency of visits, not the bill.
At the control cut we saw no significant movement in this group. That is a result too: analytics has to show not only what worked, but also where a decision needs more time.
CA — a low margin at a high frequency
Here the situation is the reverse: 2% of the base, patients come often, but the economic efficiency of a single visit is low.
We extended the service package by roughly 15% of its cost. The goal was not simply to raise the price but to change the structure of how the service is consumed and to raise the value of one treatment cycle.
As a result the share of this category shrank, and some of the patients moved into the more efficient AB/BB/BA. Sales growth in this direction — 35%.
Let me stress: for a medical business what matters is not only growth in the number of visits, but the patient moving into a more stable model of care. Shrinking a "bad" cell because people moved into a "good" one is a result, even if the total number of patients has not changed.
CC — low frequency and low margin
The smallest group, 3% of the base. We did not spend a significant marketing budget on it — instead we ran an informational communication about the widening range of the centre's services.
About 1% of the patients in this group came back into active contact.
From the point of view of classic marketing 1% is not much. But in managing a base another question matters more: how much it costs to bring a patient back and what long-term value they will generate. If no significant budget was required, even a small reactivation is economically justified.
The control cut three months later
As a matter of principle I did not assess the result immediately after the changes went live. We made the repeat cut three months later — that made it possible to compare not the team's impressions but the real changes in the structure of the base.
The outcome:
- AB / BB / BA — sales grew by 30%;
- CA — sales grew by 35%, the share of the category shrank, some patients moved into more efficient categories;
- AC — no significant movement, the group needs more time;
- CC — about 1% of patients reactivated.
It was the repeat cut that showed the main thing: ABC stopped being a one-off table and became a working management cycle.
Data → segmentation → hypothesis → action → measurement → correction.
The same analysis, repeated three months later on the same settings, is the cheapest test of a hypothesis a director has. Which is why the settings are worth writing down: with different group thresholds the comparison loses its meaning.
What changed in my approach as a director
Before the analysis we looked, like many medical centres, primarily at the general indicators: the number of patients, revenue, how busy the specialists were.
ABC made me ask different questions.
Not "how many patients do we have", but "which patients create the centre's economic stability".
Not "how do we increase the number of visits", but "how do we change the structure of services so that the patient gets more comprehensive care and the centre gets a gain in efficiency".
Not "which campaign will bring more enquiries", but "for which group of patients does it make any sense to run this campaign at all".
And that is the main management effect: the method does not hand out ready decisions, it narrows the question down to a group for which a decision can actually be taken.
The financial model of the result
In our centre the average cost of a visit is about €30 and the average margin is about €18 per patient. With 25 psychotherapists on the schedule, even a small change in how the base behaves becomes significant: every additional visit at an €18 margin produces €18 of margin result.
That is why 30–35% sales growth in individual segments means far more than simply an increase in the number of first enquiries.
The main idea was not to raise sales uniformly for all 500+ patients, but to work out where exactly the growth potential is and to point different management actions at different groups.
What the head of a clinic should analyse
A medical centre is not retail. Classic sales instruments cannot be transferred here mechanically:
- a patient may have a high cost of services at a low margin;
- the sum of a single visit may be small, but the annual value high thanks to regularity;
- a patient who is economically insignificant today may move into a stable treatment model in a few months.
The value of a patient cannot be judged from a single visit. I would recommend looking at at least four parameters: revenue, margin, frequency of visits and stability of visits over time.
And analysing not everything in sight, but whatever affects the decision:
- the problem is in the patients — we analyse patients;
- the problem is in the services — we analyse services: which ones actually generate profit, which have a high bill at low profitability, which are worth packaging;
- the question is about workload — we analyse specialists;
- you need to see two factors at once — complex analysis.
A row in the table can be anything: a patient, a service, a specialist. That is why one and the same procedure answers very different management questions.
The main conclusion
ABC turned out to be, for me, not a financial instrument but an instrument of management thinking. It lets you see the patient base not as a single mass but as a system of different behaviour models.
Somewhere you need to raise the frequency of visits. Somewhere — to offer comprehensive care. Somewhere — to revisit the economics of a package. Somewhere — simply to remind the patient what the centre can do. And somewhere — to change nothing and give the hypothesis time.
The growth we got came first of all from managing the base we already had more effectively.
And for me as a director that is the most important conclusion: growth in a medical business does not always start with attracting new patients. Sometimes it starts with the head of the clinic finally seeing the structure of their own base.
That is why today I treat ABC not as a report for the director but as part of a regular management cycle: analyse → decide → test → measure → scale.
How to repeat this yourself
You know how many patients you have. But do you know which of them generate profit? You know which services sell. But do you know which of them are genuinely worthwhile? You can see how busy your specialists are. But do you know who creates the greatest economic value?
To repeat this kind of review you need a year's export and a few minutes:
- Export the table: a row is a patient (or a service, or a specialist), the columns are the margin for the year and the number of visits.
- Anonymise it: internal codes instead of names.
- Open the analysis you need and load the file — the calculation runs in the browser, the file is not sent anywhere.
- Check the group thresholds, build the report, export it to XLSX.
- Take a decision for each group — a different one for different groups.
- Repeat the same analysis on the same settings three months later.
If the methods are new to you, start with the theory: ABC analysis in plain language and the complex ABC method.
A table on its own does not increase profit. Profit grows when the director takes a decision after the analysis — and checks three months later whether the hypothesis worked.
Analyse. Decide. Check the result.