ABC and XYZ analysis that never takes your file
An online tool with the privacy of a desktop program: how it works and how to see it for yourself — for instance, by switching the internet off in the middle of an analysis
Read MoreUpload a plain XLSX file — the calculation runs
in your browser, and the file stays with you

Choose the analysis that fits your goal — from a quick ABC ranking to a combined XYZ+ABC breakdown. Everything runs right in your browser.
One plan, all four analyses. Pay monthly or take a 7-day package.
Your current plan
€0.00
No card, no sign-up needed.
The analysis runs on the whole file, not on its first rows. Only the output is limited: part of the report is shown on screen and there is no file to take away. Enough to see the service on your own data before buying.
€28.00/ month
VAT included — this is the amount you pay.
Full refund within 14 days of purchase
All four analyses, renewed every month. Cancel any time — access stays until the end of the paid period.
€9.50/ 7 days
VAT included — this is the amount you pay.
Full refund within 48 hours of purchase
All four analyses for 7 days. One-off payment, no renewal.
For businesses: you can enter a tax number on the payment page and it will appear on the invoice. Companies from other EU countries should enter an EU VAT number with the country prefix (e.g. DE123456789) — VAT is then not charged. A Polish NIP does not change the amount and only appears on the invoice.
By paying you accept the Terms of use and the Privacy policy.
CheckBusiness is your trusted partner in business analytics, offering powerful yet simple tools for inventory management and business analysis.
CheckBusiness is an ABC and XYZ analysis tool that does the maths right in your browser.
You upload a plain XLSX export from the software you already use, pick the columns — and get a finished report. No integrations, no access to your accounting system, nothing to roll out: exactly one file is needed, and it stays with you.
The calculation runs on your own device, in a WebAssembly module. Your file is never uploaded to our server, never stored by us and never passes through our processing. This is not a setting somebody can forget to switch on — it is how the product is built: the server has nothing to keep, because the data never reaches it. The speed follows from the same design: tens of thousands of rows are processed in seconds, because there is no server to wait for.
What the service calculates:
Classes are half the job, so the report does not stop there. The service reads the result and gives recommendations for your own items: where you risk running out of stock, where money is frozen in items that do not move, what looks like seasonal demand and what looks like an item on its way out. The finished report exports back to XLSX.
The interface and the recommendations are translated into Polish, English, Russian, German, Spanish, French and Italian. The full report on your file is opened by a subscription or a one-off access package; the terms and refund windows are set out in the legal documents on this site.
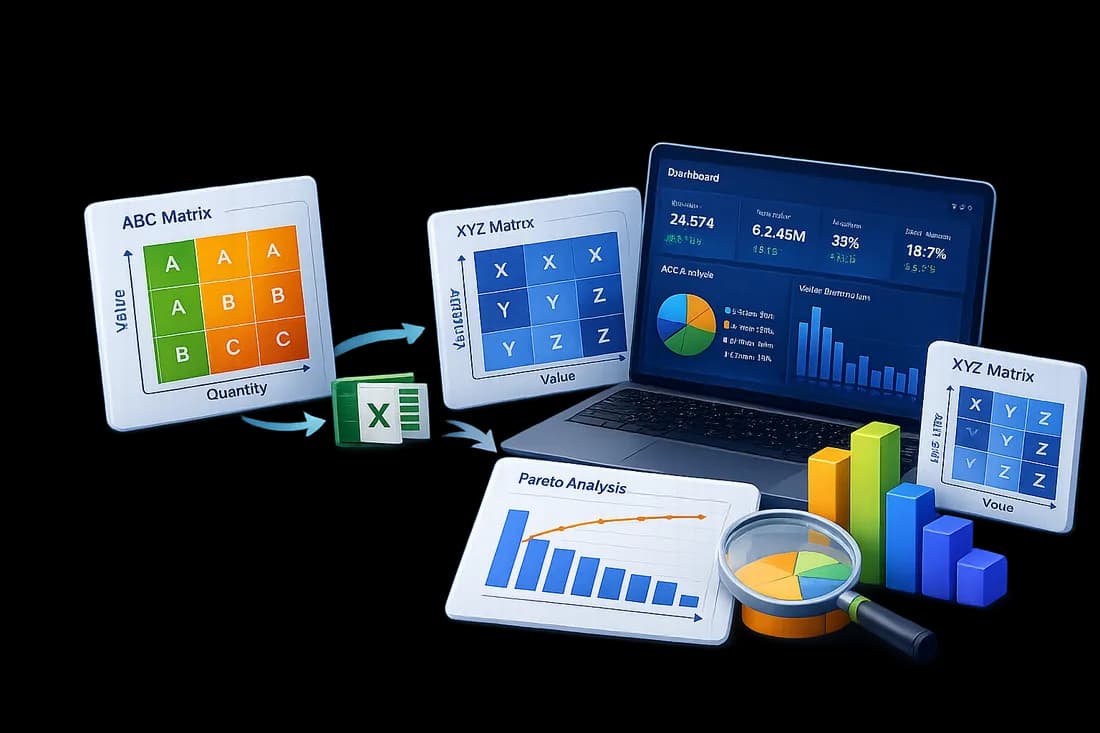

The analysis runs in your browser: your data file is never uploaded to our server, never stored by us and never passes through our processing.
The calculation module is built on WebAssembly, a high-performance technology, and runs right in your browser: there are simply no delays from server-side processing. Tens of thousands of rows are processed in seconds.
A/B/C and X/Y/Z classes are half the job. The system reads the result and gives you recommendations for your own items.
No integrations, no access to your accounting system, nothing to configure. A plain export from the software you already use is enough.
Stay updated with the latest insights and tips

An online tool with the privacy of a desktop program: how it works and how to see it for yourself — for instance, by switching the internet off in the middle of an analysis
Read More
How to split your products, customers or suppliers into three groups, and what to do with them next
Read More
Nine cells instead of three classes — and why AC and CA call for opposite decisions
Read More
A management case study by the director of a psychotherapy and addiction treatment centre
Read MoreShort answers to what people ask before uploading their first file
It does not. The analysis engine is compiled to WebAssembly and runs in your browser: the page reads the file, the calculation happens on your device, and the report and the export are built there as well. Neither the file, nor single rows, nor the results of the analysis are sent to us.
This is not a promise about our discipline but the way the product is built, and it takes a minute to check: open your browser's developer tools, the Network tab, and run an analysis — between picking the file and seeing the report there will not be a single request carrying data. The full account is on the How the data flows page.
Only what an account and a payment cannot work without:
Card details never reach us at all — they are taken by the payment provider on its own pages. Not a single row from your spreadsheets is here, and none can be. Storage periods and your rights are in the Privacy Policy.
No, and this is not a matter of access rights: that data is not on our servers at all. We do not know what you analysed, and we do not even know whether you ran an analysis: a "number of calculations" metric cannot be collected without receiving the data itself.
That property has a flip side, and it is fairer to say it up front: we cannot restore your analysis either. Closing the tab takes it away, because no copy ever existed anywhere but your browser.
One XLSX file; the .xls and CSV formats are not supported. The first row holds the column headers, then one row per item, and you need a column with a name or an SKU so that the report can be read.
The rest depends on the analysis:
Completely empty rows are dropped, and the remaining columns are carried into the report unchanged.
One requirement for the export itself: it must not contain repeated items. The service does not detect or merge duplicates — an item that lands in the file twice lands in the calculation twice, so the shares, the classes and the recommendations come out wrong, and that is hard to spot in the report. Merge such rows in your own system before uploading.
Tens of thousands of rows are an ordinary size and are processed in a few seconds. The limit is set by your device's memory, not by our server: there is nothing to compute on our side, so there are no queues and no volume caps "by plan".
For very large exports it is worth opening the site on a computer rather than a phone — the difference is exactly the available memory. Speed depends on your machine rather than on our load, for the same reason.
Yes. The report goes back out as XLSX: your table with all the original columns plus the calculated ones — shares, the coefficient of variation, classes and the cell code, depending on which analysis you ran. The file is assembled in the browser and saved straight to your machine.
In demo mode the export is unavailable — there the report can only be viewed.
By the number of indicators. Classic ABC ranks items by a single column and splits them into classes A, B and C by cumulative share: the first 80 % of the result, the next 15 %, the remaining 5 %. The thresholds are set before the run.
Complex ABC computes classes by two columns at once and gives an item a two-letter code, from AA to CC. That shows what a single indicator cannot: that an item brings little revenue, say, while holding a noticeable part of the money tied up in stock.
If what matters is not the size but how even the demand is over time, that is XYZ.
XYZ analysis looks at how stable demand is: for every item it computes the coefficient of variation — the spread of sales across periods relative to the average. Class X means even, predictable demand, Y means noticeable swings, Z means a spread wide enough to make a forecast from past periods unreliable. The default thresholds are 10 % and 25 %, and both are configurable.
Formally two periods are enough, but a spread over two points means almost nothing: take a year by month, or at least half a year. Columns are picked in the order time runs — the service reads them as a series and does not guess the order.
No. They are a set of deterministic rules of the "if this, then advise that" kind, built on the ABC/XYZ matrix. The same data always produces the same result, and every card can be explained with the numbers from your own report.
It could not be otherwise: a language model runs on somebody else's server, and getting advice from one would mean sending your data there — precisely what this product does not do. The rules run where the calculation runs: in your browser.
Demo mode works without paying and even without registering, and it computes the whole file, not a part of it. Only the output is limited:
The summary figures, the class matrix and the number of processed rows are computed and shown across all the data in the file. That is why demo mode shows how the tool behaves on your own data rather than on a prepared example.
Only in the way you pay: the feature set is the same, and both open all four analyses in full.
The package suits a one-time job — a stocktake or a report; the subscription suits coming back every month. Prices and current terms are shown in the pricing section on the home page and on the payment page before you confirm anything.
Payment goes through the pages of the payment provider Stripe — by card or with BLIK. The payment page shows the exact set of methods itself: it depends on the country and the currency. Settlement is possible in zloty and in euro.
Card details are entered at the provider and never reach us: what stays on our side is the fact of the payment, its amount and the period of access bought. Access opens as soon as the payment is confirmed.
Yes. The invoice is issued automatically and arrives by e-mail right after the payment; it is also available in your account, in the purchase history. On the payment page a company can enter its tax number, and it goes into the document.
Prices include VAT: that is the final amount to pay, the tax is already inside it. For companies from other EU countries with a valid European VAT number no tax is charged, and the amount to pay does not change because of it. On a refund the provider issues a credit note.
Cancelling a subscription is one click in your account, at any moment: the next charge does not happen, and access runs to the end of the period already paid for and is not cut short. There is nothing to cancel about the one-off package — it does not renew and ends by itself.
A refund is full and unconditional if you are within the window:
You do not have to give a reason: the form has a field for it, but the field is optional — we do not check it and it does not affect the decision. A couple of words still help: that is how we learn what to fix. Whether you used the service or not we do not check either — as said above, we cannot know that.
So that the rule is not abused, there is one automatic refund per person; if it has already been used, write to us and we will look at the case by hand. After the window there is no refund, but a subscription can still be cancelled in the ordinary way. The full rules are in the Terms of Use.
Get in touch with us - we'd love to hear from you!
Have questions about our services? Want to discuss how we can help your business? We're here to help! Reach out to us through any of the channels below.
Monday - Friday: 9:00 AM - 6:00 PM
Saturday: Closed
Sunday: Closed