ABC analysis

Classic analysis for one column

  • Your file never leaves the browser
  • Tens of thousands of rows in seconds
  • Decisions, not a table
  • Any XLSX export
ABC analyse

What ABC analysis is

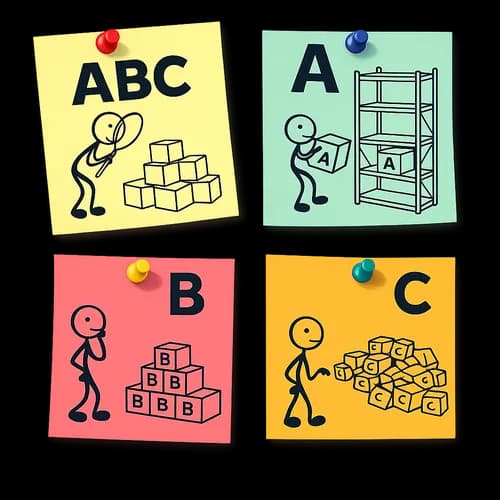
ABC analysis ranks items by a single metric — revenue, margin, quantity — and splits them into three classes by cumulative share. Class A holds the items that make up the first 80 % of the result, B the next 15 %, C the remaining 5 %. The 80 and 95 thresholds are set before the run: if your practice uses different ones, change them in the wizard.

What the file must contain

One XLSX file: the first row holds the column headers, then one row per item. You need one numeric column to rank by and a column with a name or SKU so the report can be read. Completely empty rows are dropped; every other column is carried into the report unchanged.

Important: merge duplicate rows before uploading. The service does not detect or combine duplicates — an item that appears in the file twice is counted twice, and the shares and classes come out wrong.

What the report contains

Your table gains the item's share of the total and its class — A, B or C. Next to it is a summary: how many items and how much of the result fall into each class. A separate block holds the recommendations — what to protect, what to review, where money is frozen. The finished report downloads back as XLSX.

How it differs from the other analyses

One metric, one snapshot. If an item has to be seen through two metrics at once — revenue and stock on hand, say — that is complex ABC analysis. If what matters is not size but how steady demand is over time, you need XYZ analysis. XYZ+ABC answers both questions at once.

share = xᵢ / Σx × 100%

xᵢ
the item’s value in the chosen column — revenue, margin, quantity
Σx
the sum of that column across every item in the file

Items are sorted by share, largest first, the shares are added up from the top, and the class is decided by the cumulative share of the items above the current one: below 80% it is class A, below 95% class B, after that C.

That rule explains the thing people ask about most: the item on which the cumulative share crosses a threshold stays in the class it was in. In the table below SKU-104 pushes the running total to 82.4%, yet its class is A — because everything above it adds up to 73.9%.

A worked example on ten items

ItemRevenueShareCumulative shareClass
SKU-101412,00036.5%36.5%A
SKU-102265,00023.5%59.9%A
SKU-103158,00014.0%73.9%A
SKU-10496,0008.5%82.4%A
SKU-10574,0006.5%88.9%B
SKU-10651,0004.5%93.5%B
SKU-10733,0002.9%96.4%B
SKU-10821,0001.9%98.2%C
SKU-10912,0001.1%99.3%C
SKU-1108,0000.7%100.0%C

Revenue for the period, each item’s share, the running total and the class at thresholds 80 and 95.

Questions people ask about ABC analysis

How do you calculate ABC analysis in Excel?

Sort the items by the chosen metric from largest to smallest, compute each one’s share of the column total, add the shares up from the top, and mark the classes off against the running total: up to 80% is A, up to 95% is B, the rest is C.

That is four formulas and a manual sort every time the export is refreshed. Here the same computation runs on the uploaded file, and the shares and classes come back as a finished XLSX table.

What is cumulative revenue and what is it for?

Cumulative revenue is the sum of the shares of every item from the largest down to the current one. It shows how much of the result a small part of the assortment produces: in the table above, four items out of ten make 82.4% of revenue.

Classes are decided by that running total rather than by a single item’s share: 8.5% on its own says nothing, while the position in the cumulative total does.

Why 80 and 95, and can they be changed?

They are an industry default, not a law: 80% of the result from 20% of the items is an observation that fits retail and distribution well. If your practice uses different boundaries, set them in the wizard before the run — both thresholds are editable.

The computation itself does not change; only the line where a class turns from A into B and from B into C moves.

The theory behind the method — in the article: What ABC analysis is — in plain language